About the class
This class is part of a discipline at the university that teaches R for environmental sciences graduate students. In this discipline, the teacher already taught how to import data to R, how to manipulate data, create simple graphs, and the current content is how to make reproducible reports.
In the last class, the teacher made an introduction about how to do the analysis in a reproducible way using R Markdown. In this class, the students will learn how to add figures in the reports.
1. Learner persona
A) Maria
General background: Maria is a PhD student in Environmental Sciences, and she was born and lives in São Paulo, Brasil. She enjoys spending time with her family and her dog called Zeus.
Relevant experience: This is her first experience with R. In the undergrad and masters course, all her analysis were made using Excel.
Perceived needs: She thinks that learning R Markdown could be helpfull to apply in her research. She wants to make reports for the analysis of her research, that could be updated when new data is available.
Special considerations: Maria does not have access to a good internet connection in her house, and sometimes she can’t watch the live online classes.
2. Concept map

Concept Map made with CMap Tools
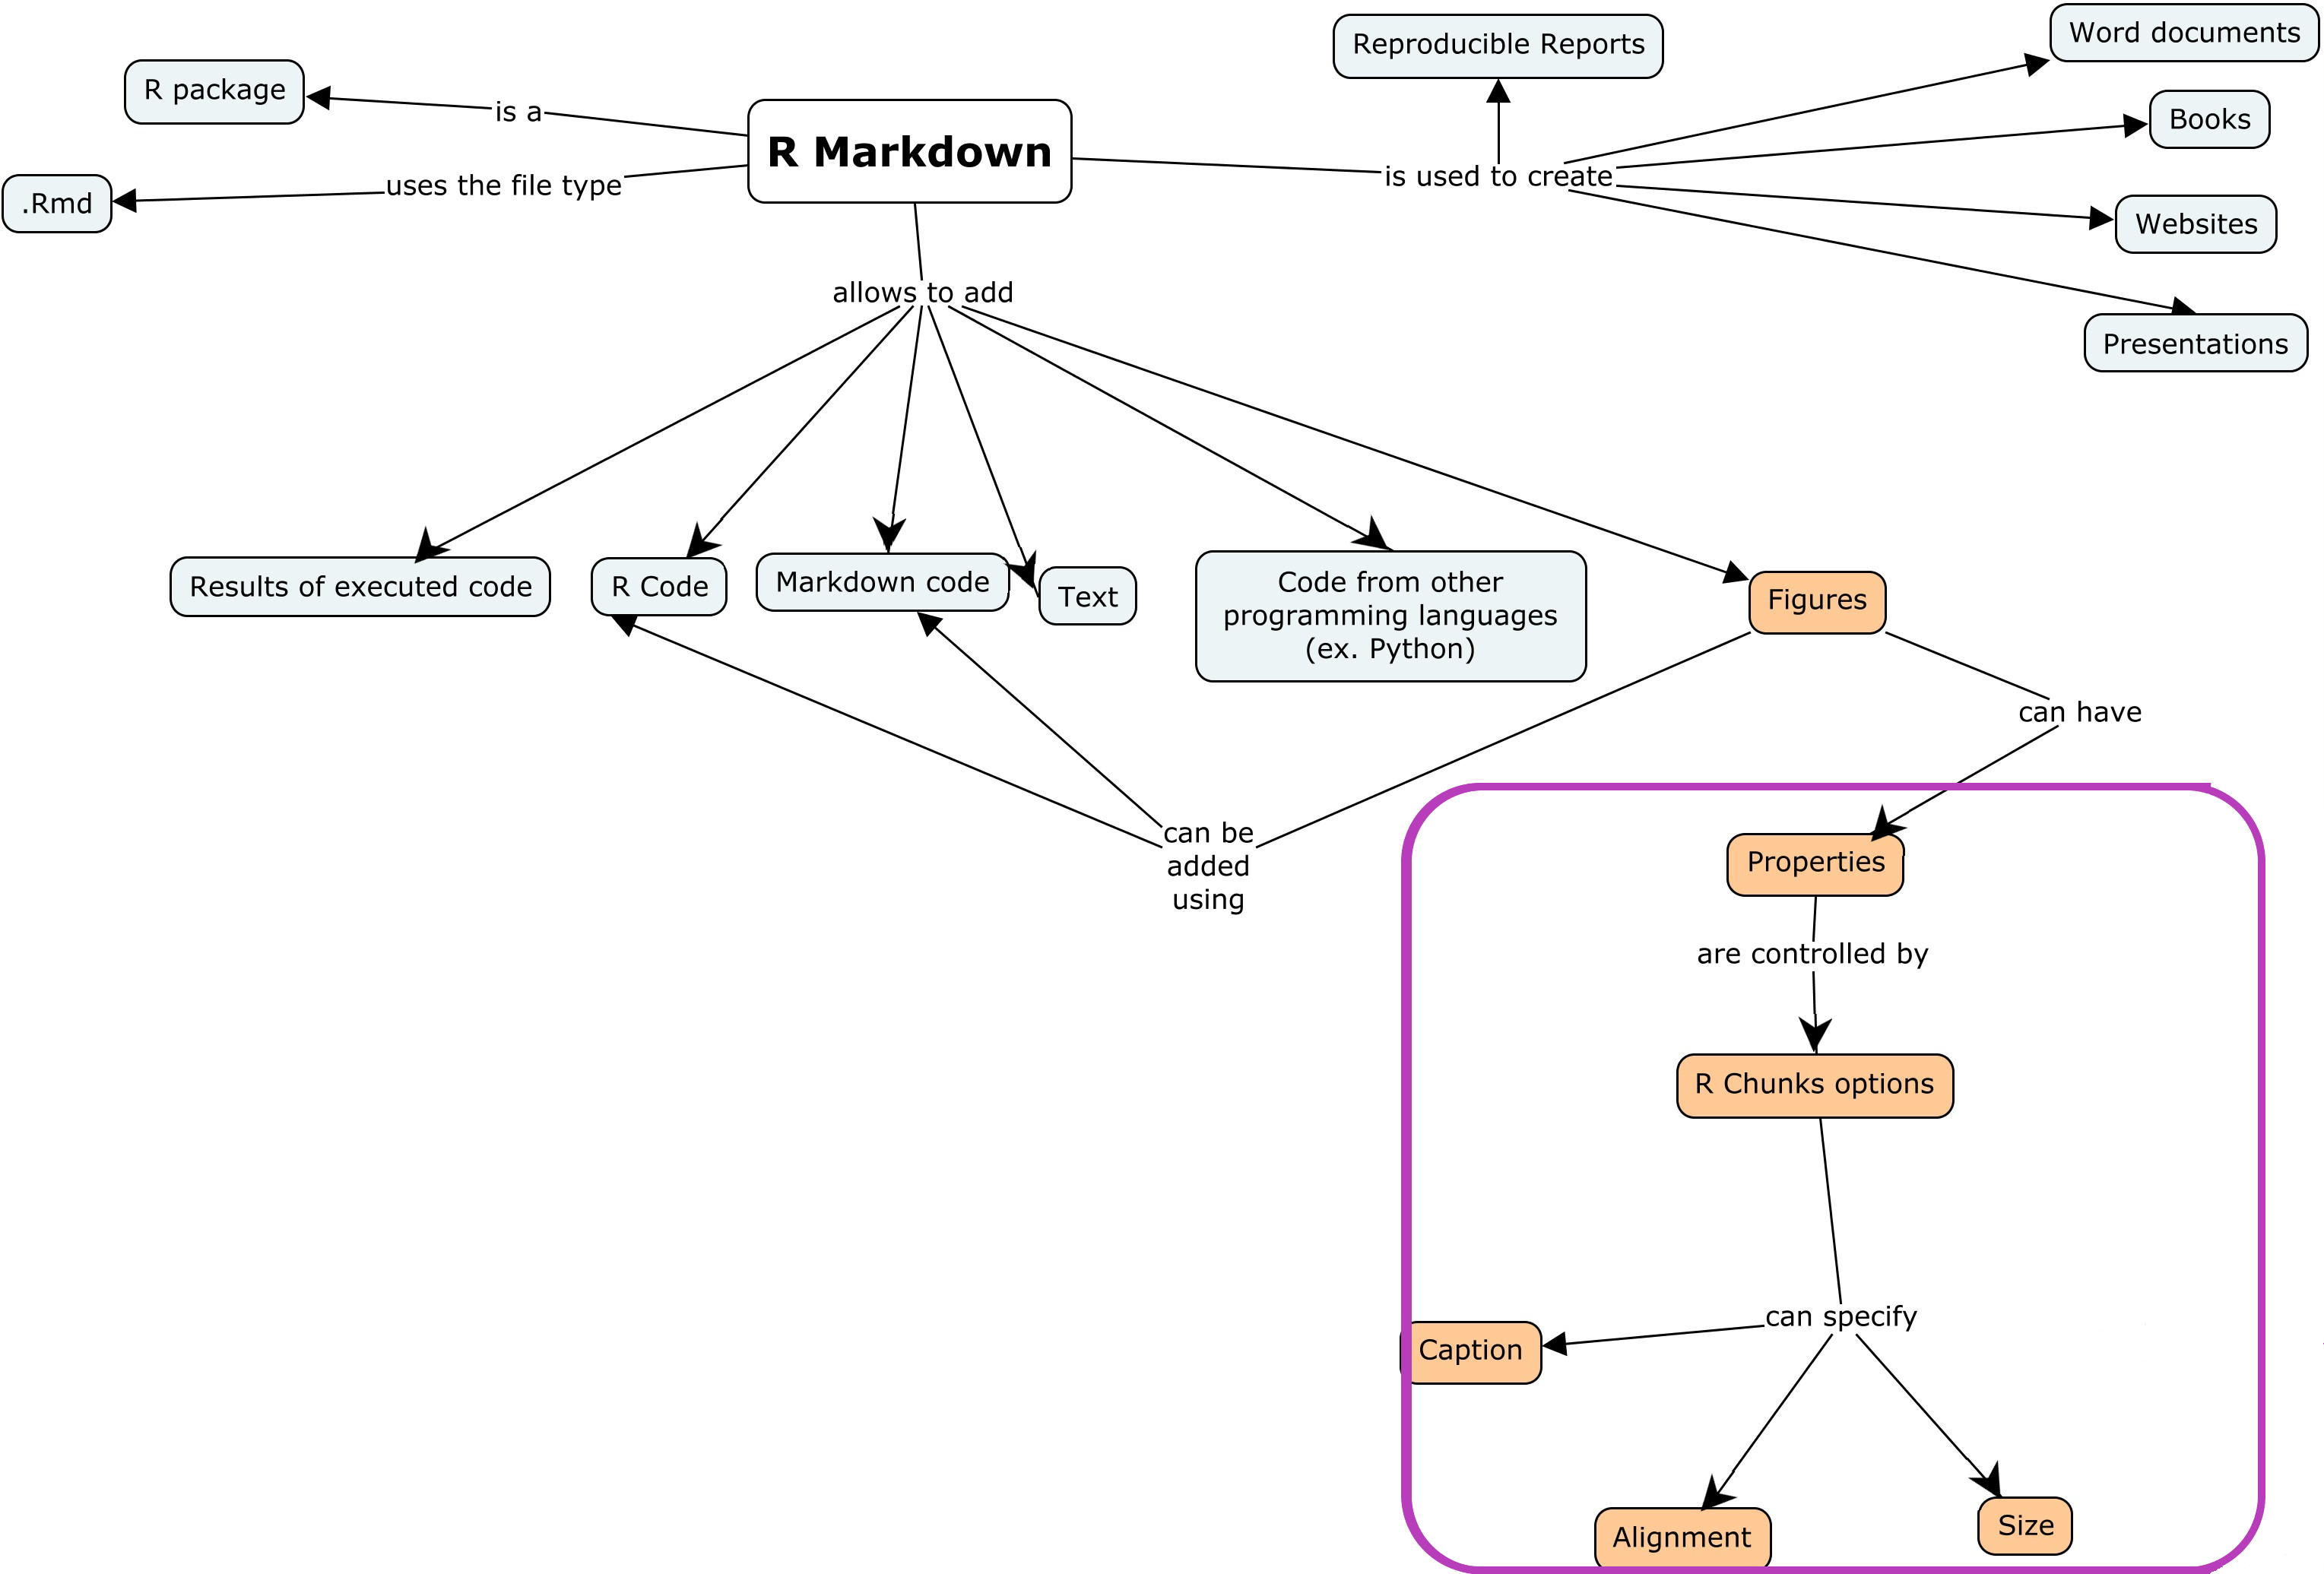
3. Formative Assessment
4. Slides
- File used in the demonstration:
demo.Rmd